

My Claude Skill for Automated Weekly Google Analytics Reports
A simple setup that turns scheduled CSV emails into an Artifact report so you can actually see what’s going on in your business.


If you are building an audience, a newsletter, a coaching business, or a company online, you need some way to see whether the work is going anywhere.
Google Analytics will not explain your whole business. But it can show you whether people are finding your site, where they came from, which pages are bringing in new people, and whether they stay long enough to care.
But, the problem starts after the tracking is set up.
Maybe you review Google Analytics every week, but still spend time clicking through traffic sources, landing pages, and search performance before turning it into a summary.
Or maybe you are more like me. The reports are there, but you keep putting them off because opening them feels like starting a small analysis project from scratch.
Every Monday, six CSV reports arrived in my inbox: traffic sources, landing pages, search queries, and engagement data from Google Analytics and Search Console.
I had already set up the reports I wanted. But some weeks, I skipped them completely because opening the files still felt like starting a small analysis project from scratch.
And when I did open them, I still had the same problem.
The numbers were there, but the insight was not obvious.
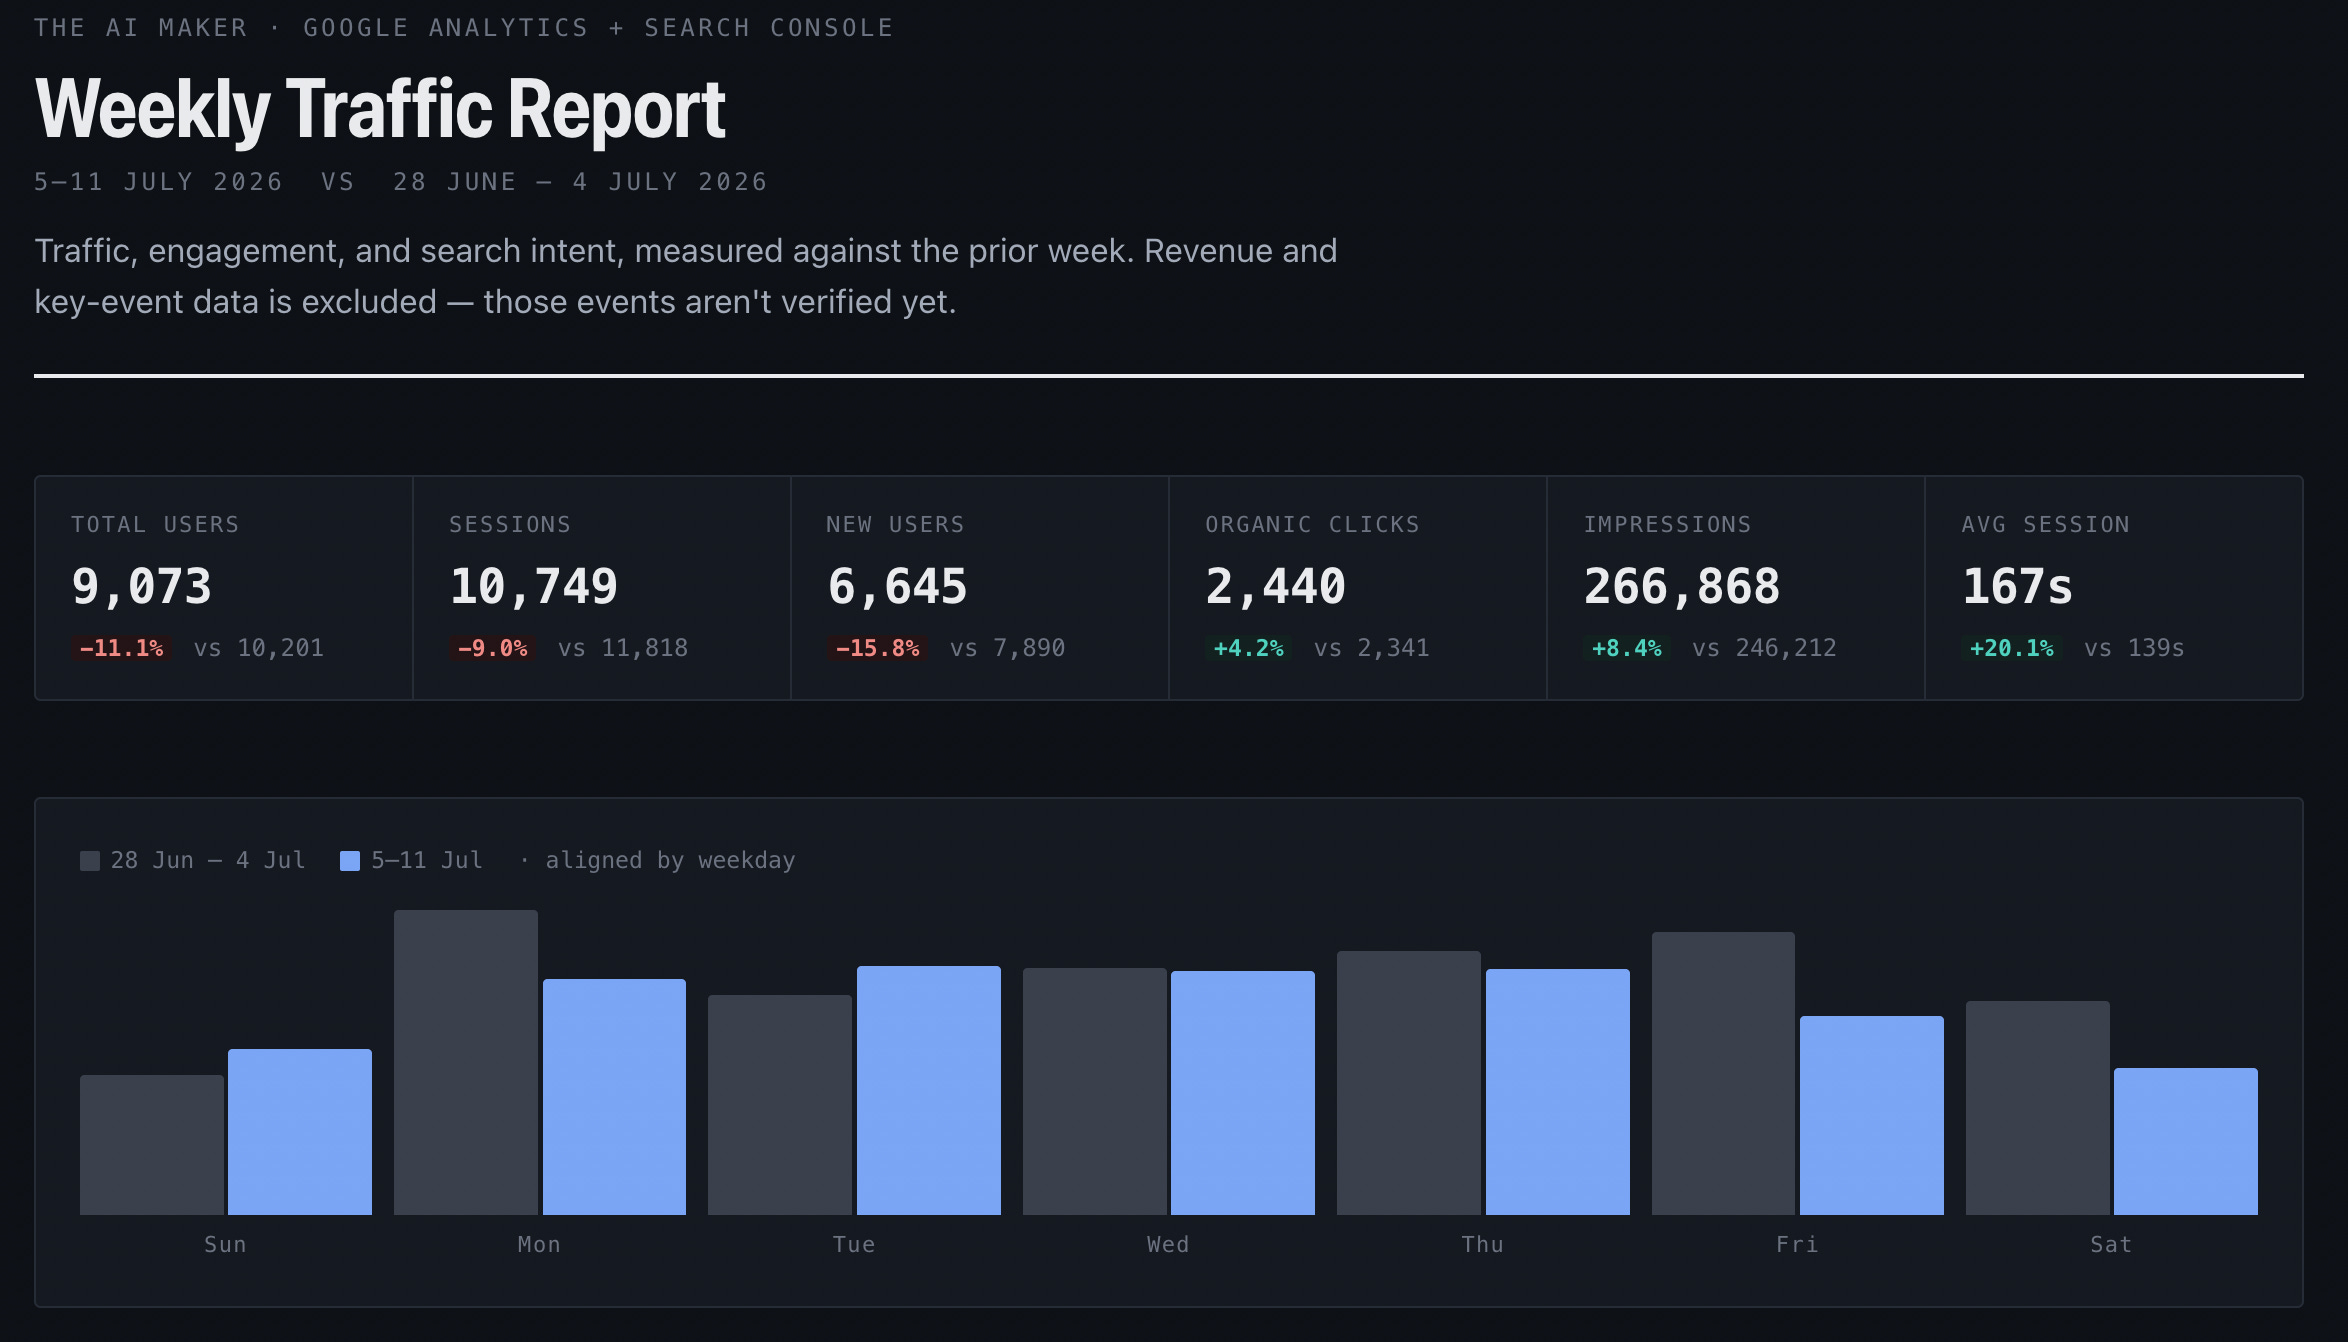
One recent week, my overall traffic fell 11%. That sounds bad until you look closer. Organic clicks grew 4%. Search impressions grew 8%. Average session duration went up 20%.
So what happened?
Fewer people came to the site, but search was still moving in the right direction and the people who arrived were staying longer. The real drop was coming from direct traffic, not search.
That is useful information. But I had to compare separate reports and figure out the story myself before I could see it.
So I built a weekly Claude Code routine that creates an Artifact report:
The routine is the repeatable Monday job. I packaged its instructions as a Claude skill, so I do not need to explain the reports, comparisons, or output format again every week.
The Artifact is the visual report the skill creates. It brings the separate CSV files into one place, with the charts, tables, and weekly summary I need to review.
Every Monday, Google sends the same six reports with the dimensions and metrics I already care about. Then I run a routine in Claude that reads the CSV files from my email and turns them into a visual Artifact report.
More importantly, it saves the raw data and finished report in a dated folder. After a few weeks, I do not just have a snapshot. I have a history I can compare.
In this post, I will show you the exact setup: the reports I schedule, the email routine, the Claude skill that generates the Artifact, and the folder structure that stores every week of data.
All of these can be applied across Claude Code Desktop, Cowork, and ChatGPT Work.
What you will have after you set this up
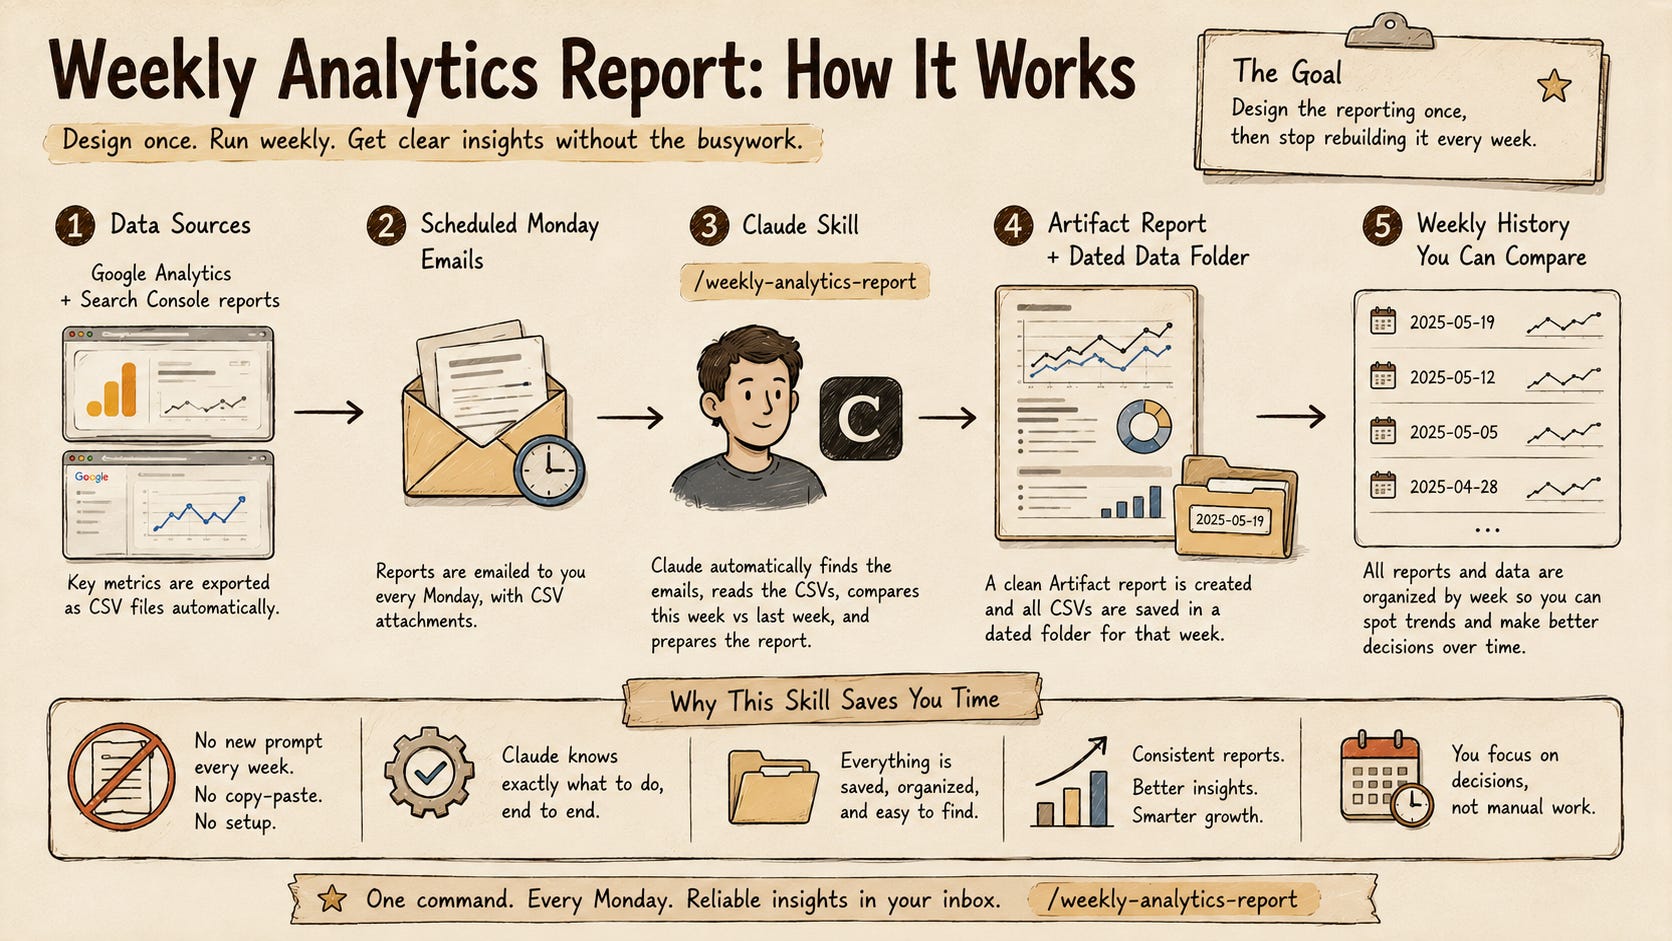
The goal is to design the reporting once, then stop rebuilding it every week.
When your scheduled reports arrive on Monday, Claude will trigger the skill automatically. It already knows which email attachments to find, what each CSV contains, how to compare this week with last week, how to create the Artifact, and where to save everything.
The skill is called /weekly-analytics-report.
By using the skill, you do not need to write a new prompt every week or recreate the same report by hand.
Here is the workflow:
Google Analytics + Search Console reports

    -> scheduled Monday emails

    -> Claude skill

    -> Artifact report + dated data folder

    -> weekly history you can compare
By the end of this post, you will have:
A fixed set of Google Analytics and Search Console reports built around the questions you want answered each week.
CSV files delivered to your email automatically every Monday.
A Claude skill you can run without writing a new weekly prompt.
A visual Artifact report that brings the separate reports into one clear weekly update.
A dated folder containing the raw CSV files and finished report from every week.
The outcome is simple: your weekly reporting becomes one repeatable step, and each new report adds another week of history you can use to see what is actually growing.
💡 The six reports in this post unlock the deeper search-and-content version of the skill. But they are not the only reports it can use. If your business tracks different things, such as leads, bookings, product use, or campaign performance, you can schedule those Google Analytics reports instead. The skill inspects the CSV files before it runs and creates a general movement report when the standard set is not present.
🚨 Before you start
This workflow only works when the data is already being collected.
Before you follow the reporting setup in this post, make sure you have:
Google Analytics set up for your website or Substack.
Google Search Console set up and verified for the same site.
Your Search Console property linked to your Google Analytics property.
An AI setup that can access the Gmail inbox receiving the scheduled report
There are many resources and guides on YouTube that show you how to set up both Google Analytics and Search Console.
Once the connection is in place, you can use Google Analytics as the place where you build and schedule the reports for this workflow. That includes the normal traffic and engagement data from Google Analytics, plus the search-query and organic search data from Search Console.
You do not need to create one set of scheduled reports in Search Console and another in Google Analytics. For this setup, the reports all come from Google Analytics.
Your AI also needs a way to read the CSV attachments after they arrive. The exact setup depends on whether you use Claude Code, Claude Cowork, or ChatGPT Work. Use the Gmail connection available in your setup, then make sure it can search the inbox and read the report attachments.
In my case, Claude Code accesses my Gmail through Google Workspace CLI. If you want to follow the same path, read my Google Workspace CLI setup guide first. Once that connection is working, the weekly report skill can find the scheduled emails by itself.

Why I used scheduled reports instead of MCP
Someone might ask why I did not connect Google Analytics through MCP and ask Claude to pull the data directly.
I have not tested the Google Analytics MCP route yet, so I am not going to pretend I know which option is better.
But I do know the job I am trying to solve here. I am not opening Claude every Monday and asking a new question about my data. I need the same set of reports, with the same dimensions, metrics, filters, and date range, every single week.
Scheduled reports let me define the data once. Every Monday, the same files are already waiting in my email, and the skill already knows what to do with them.
MCP might be useful for a different job, especially when I want to explore something new in the data. But I am building a repeatable Monday routine that turns a fixed set of reports into a visual record of how my Substack is growing over time.
Now, let’s dive in.
Decide what you actually want to learn each week
Before setting up any report, decide what you need the weekly review to help you understand.
Google Analytics can track far more than most of us need to look at every Monday. If you schedule every available report, Claude will have more files to read, but you will still end up with a noisy report that does not help you decide what to do next.
So, instead of asking, “What can Google Analytics show me?” I started with a simpler question: “What would I want to know before I decide what to pay attention to this week?”
For my newsletter, that became five questions:
Did traffic change, and did the quality of that traffic change with it?
Which source or channel explains the change?
What are people searching for, and are any topics gaining or losing momentum?
Which pages are bringing in new readers, and are they spending time with those pages?
Is there anything worth checking, fixing, or building next?
Here is how those questions map to the reports I use:
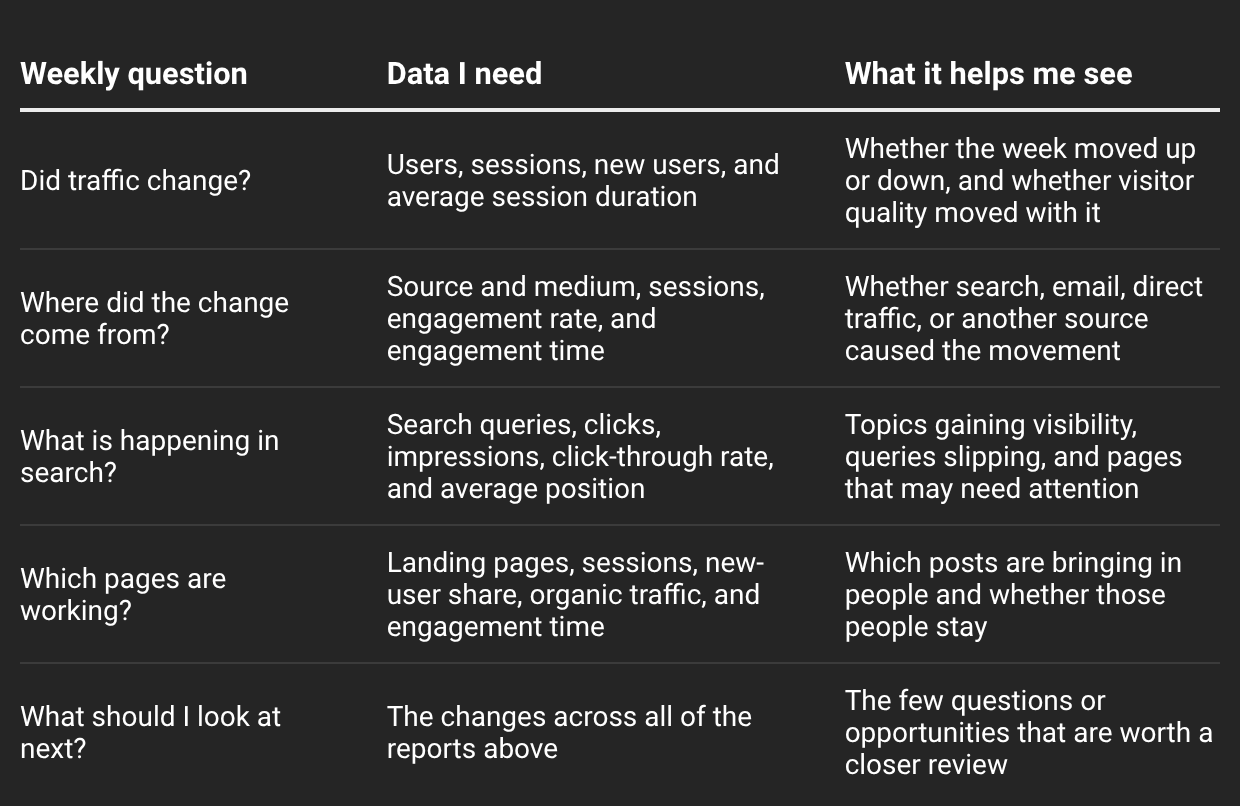
These are the questions for my own newsletter. Your version might focus on leads, booked calls, product pages, course sign-ups, or sales instead of content pages and search queries.
The rule is the same: start with the decisions you want to make, then choose only the reports that give you the evidence for those decisions.
Set up the Google Analytics and Search Console reports
I use six reports. Together, they give me a weekly view of traffic volume, traffic quality, acquisition, search demand, and content performance.
You do not need to copy this exact set if your business works differently. A coach might care more about lead pages and booked calls. A SaaS company might care about product pages and trial sign-ups. But these six reports are a good starting point if your site grows through content, search, email, or an audience.
I also have a video walkthrough below that you can watch to set up and run this entire automation.